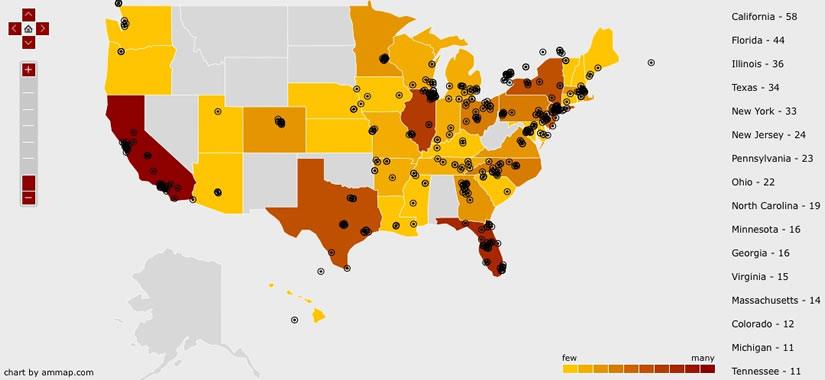
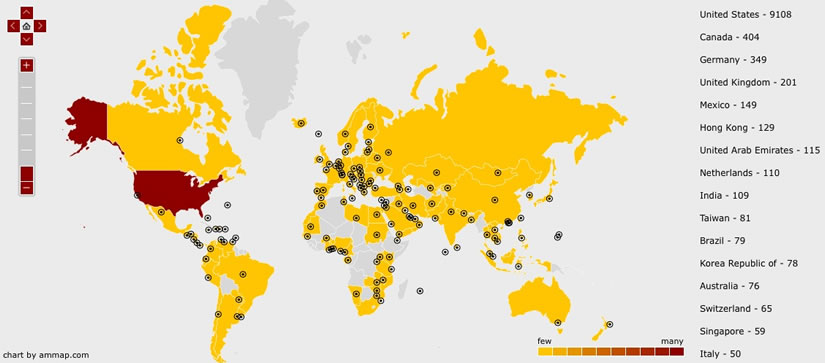
Clients using our bulk mail service have for a long time been able to see a list of U.S. states and countries that viewed an email newsletter. We have taken that data to the next level and created heat maps. View tracking is very accurate because we capture the IP address of each person that views a mailing. We then use that data to build heat maps showing which geographical areas had the most traffic. As of now, when our clients view the details of a sent mailing they will see a heat map for the World and a heat map for the U.S. The World view will quickly show which countries had the most views, and the U.S. view which states had the most views. They can zoom in on a specific state and see where in the state each view came from.
Clients can also see the exact number of views from each country and each state. The screen captures below are examples of actual email marketing campaign heat maps.

Heat Map United States View Example

Heat Map World View Example

